Nuclear Power Correlations with Average Retail Electricity Rates: 2018-2024
6/29/2025
We’ve now arrived at our final, major contributor of electrons to the US grid: nuclear power.
Unlike earlier power generation schemas – nuclear represents a slightly different format in a variety of ways. For one – nuclear energy outputs really didn’t vary much over this six-year examination. It’s domestic footprint – as we’ll dissect more closely later on – has remained relatively stoic. As the following chart demonstrates – US nuclear production only dwindled by roughly 22,500 GWh/year during this multiyear window; encapsulating not even a 3% drop.
Market shares (in terms of total energy generation and cumulative sales) during this time frame barely budged southward beyond 1%. Given this YoY consistency in domestic nuclear capacity – we didn’t feel inclined to run any single-factor ANOVA test(s) to measure between-annual data population variances: if those from more profoundly dynamic power generators failed to yield even a decent number of significant variations – then there is certainly no reason to believe that nuclear would behave any differently!
But the correlation data between nuclear power, and average, retail electricity prices tell a slightly different story…. Immediately below are the graphed trendlines of each annual group’s Pearson r value, as calculated using each state’s average grid costs and both its respective % of cumulative electricity sales and total energy output (in separate graphs).
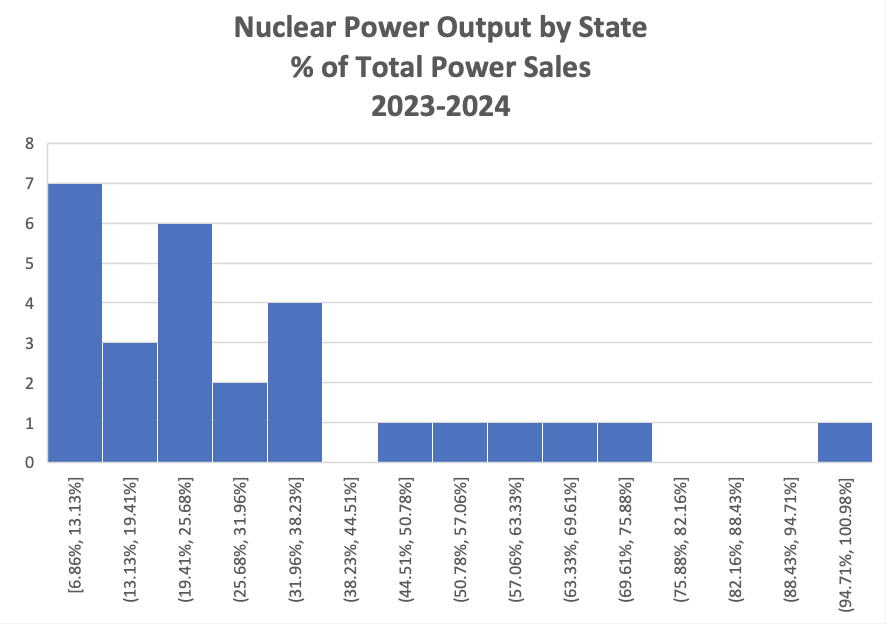
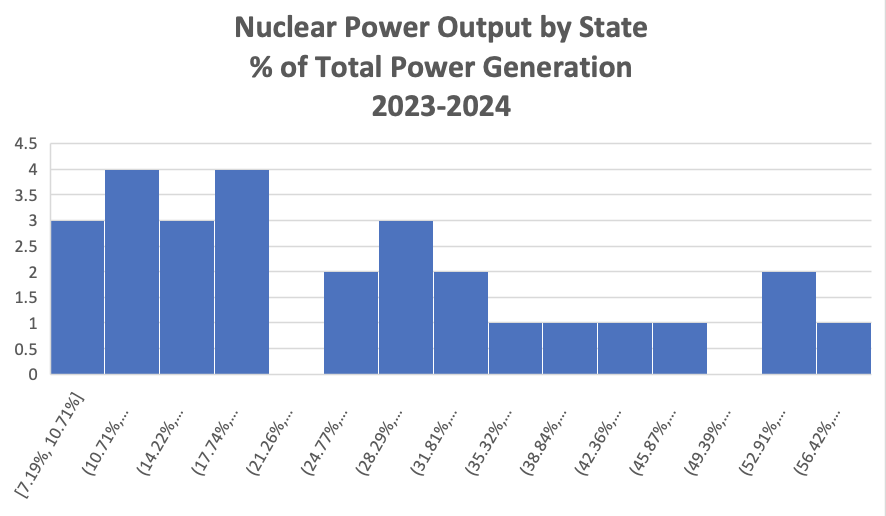
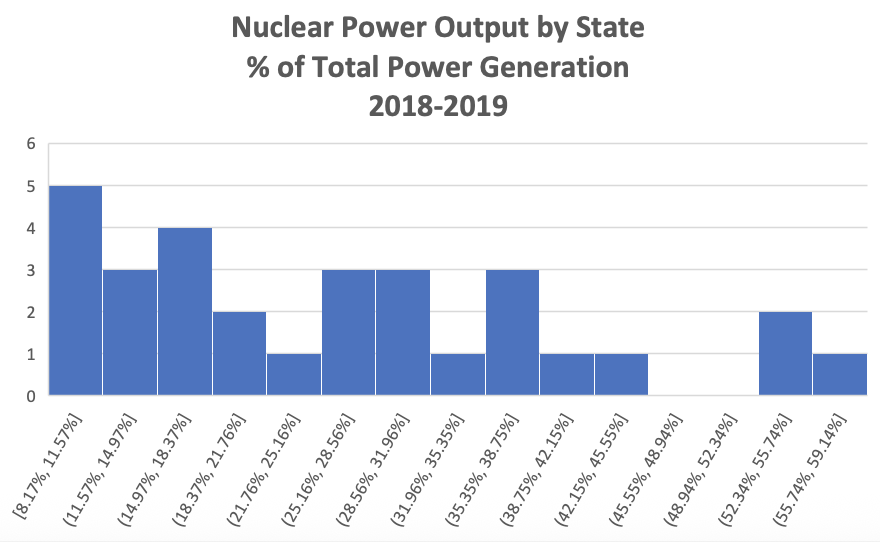
Directly above you’ll find the commensurate r values for the Spearman Rank correlation procedure; since these state-by-state data sets didn’t appear to fit within the parametric classification, as shown in the following histograms:
It’s logical to assume that such parallel and consistent, YoY population sets would yield very similar correlation coefficients; regardless of whether the data was normally distributed, or converted into ordinal rankings. But that doesn’t appear to be the case; especially as it relates to the % of total power generation: there is a progressive improvement in nuclear power, and its congruency with declining grid prices over time.
A few further bullet points to note:
Due to continued reductions in industry-wide fuel, operating, and capital expenses - nuclear energy generation costs fell from 2020 ($34.08/MWh) to 2021 ( $32.32/MWh), then again in 2022 ($32.05/MWh), and once more in 2023 ($31.76/MWh): https://www.nei.org/CorporateSite/media/filefolder/resources/reports-and-briefs/2024-Costs-in-Context_final.pdf#:~:text=Operating%20costs%20increased%20from%20$22.87%20per%20MWh,reduction%20compared%20to%20the%20peak%20in%202012.
Even though nuclear power correlations with higher retail electricity prices strengthened from 2018-2019 to 2019-2020; nuclear energy production costs actually decreased by 4.6% from 2019 to 2020: https://nei.org/CorporateSite/media/filefolder/resources/reports-and-briefs/Nuclear-Costs-in-Context-2021.pdf
The visible (and rather precipitous) drop in r values between 2022-2023 and 2023-2024 looks to be intertwined less with operational efficiencies, and more with federal tax incentives:
The Zero-Emission Nuclear Power Production Credit (45U) of the IRA took effect at the start of 2024. 45U proffers up to $15/MWh for energy supplied by qualified nuclear facilities placed in service before August 2022.
Vogtle Units #3 and #4 were only eligible for the 45J PTCs (providing $18/MWh) under the 2005 Energy Policy Act; the only two domestics reactors to qualify.
Vogtle #3 begin operations at the end of July 2023
Vogtle #4 commenced near the end of April 2024
Nuclear doesn’t really follow the Henry Hub Index price signals that natural gas, coal, and VRE adhered to in earlier examinations
No significant drop in nuclear power-to-electricity cost correlations were observed from 2020-2021 to 2021-2022 – unlike within the coal-fired and combined wind-solar power correlation graphs – when natural gas pricing surpassed $7-, $8-, and $9/MMBtu
The signals here insinuate that nuclear power functions as more of stand-alone power source for the US grid; almost as if nuclear operates in a vacuum
This is likely due to nuclear’s incredibly high capacity factor (low-to-mid 90%); signifying that it performs irrespective of the other platforms
It stands to reason that the impact of subsidies for a specific technology (in this case – nuclear power) would be more profound if said technology is divorced from outside influences. This could help explain why a relationship between nuclear output and decreasing energy costs manifested so suddenly and distinctly as 2023 transitioned to 2024; especially when compared to the credit boosters that both wind and solar energy platforms received as a result the IRA. As previously demonstrated – the correlation between VRE and retail costs for the grid are partially impacted by the index price of natural gas. Consequently – the presumed benefits of augmented tax credits for both wind and solar assemblies on electricity costs are more difficult to discern than those of nuclear.
Just to summarize a couple of key findings here:
The nuclear industry really is the sole determinant of its economics: the more it can efficiently operate; the more attractive its electricity appears to the rate payer
The industry looks to still be streamlining its performance; even after decades of operation


