Natural Gas Combustion Power Correlations with Average Retail Grid Rates: 2018-2024
5/28/2025
Natural gas combustion constitutes the largest source of electrons on the US grid when compared to all other individual power generating technologies. Its flexible nature and inshore abundance are hard to refute! Yet our early March ‘25 analysis revealed that this top contributor exhibited a mild correlation with higher, average retail rates for the grid after examining the % of total power produced by state, and their respective, average retail costs over a 12-month period between October 2023 and September 2024. How does this relationship stand up over a broader, multiyear span?
Expectedly – natural gas application across our domestic grid has ticked upward from 2018 until 2024; as demonstrated in the below chart. Cumulative energy output from natural gas combustion nationwide jumped by over 300,000 GWhs, and market shares of total generation and electricity sales surged by 6%-7% over this six-year window.

However – correlations between average electricity pricing and both of the aforementioned categories altogether remained relatively flat over this time frame. The following graphs detail this steady increase in market shares of natural gas-fired power across the US grid; while YoY positive correlations with relatively elevated retail prices only varied nominally.

Please note that said correlations between subsequent, average costs and natural gas combustion as a % of state-by-state electricity sales were all below the designated |0.3| Pearson Correlation r value demarcation (as discussed in the “’23-’24 Statistical Correlations” tab). Therefore – the remainder of this evaluation will focus on the more consequential natural gas combustion as a % of total power generated data.
Some additional items of note here:
While this 300,000+ GWhs of supplemental natural gas-fired energy represents just over a cumulative 20% increase – its YoY equivalence only registers a 3.4%/year gain over six years.
As was observed within the “Coal Correlations: 2018-2024” tab – a single-factor ANOVA analysis of subsequent data population transformations from raw energy tallies to %s of GWhs generated revealed that these YoY numbers were indeed NOT significant:
F value = 0.299; F critical = 2.245
p value = 0.913
Both F and p-values for the transformed populations under the natural gas combustion as a % of sales umbrella also fall out of the range of statistical significance
Recall from the “’23-’24 Statistical Correlations” tab that transformed, natural gas-related data appeared to match the classic bell curve associated with data normality. Therefore, non-parametric Spearman Rank correlations tests were not deployed in this analysis…
So the relative flatness of these YoY correlations with elevated electricity prices could be partially explained by the congruency of the data: between-group differences between each annual population is NOT statistically significance. Statistically similar data sets should exhibit homogeneous r values.
But upon closer inspection of this aggregated, natural gas-fired data – there are some very interesting nuances that are worth fleshing out; especially as they relate to the renewable energy and coal-fired correlation analogs of prior examinations. A detail synopsis is as follows:
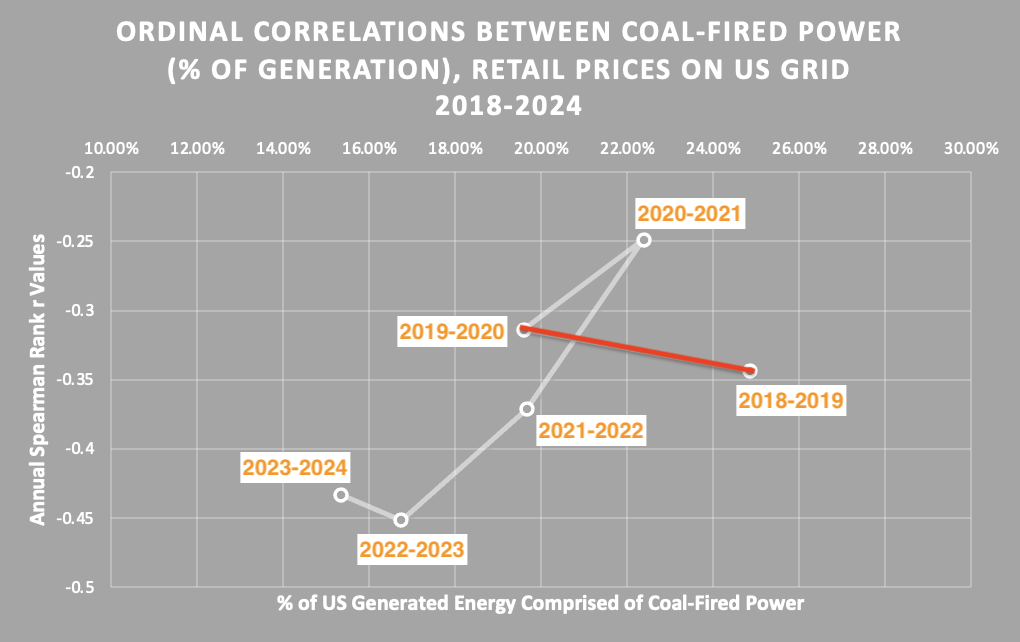
2018-2021: Domestic natural gas utilization surges by over 3% of the cumulative US grid from 2019 to 2020; as indicated in red in the below, left-handed graph. It’s a trend that looks dramatic on paper, but really not unexpected given the market dynamics in proceeding years. Rather expectedly – this upswing in natural gas demand is synchronous with a decrease in the US coal combustion market (from an ordinal ranking standpoint) by roughly 5% of the nationwide grid during the same time frame (shown in red on the right). Correlations between natural gas power generation and average grid rates just slightly improve; while those pertaining to coal analogously decline.

Then during 2021 – trajectories reverse: natural gas (as % percentage of total, domestic energy produced) retreats by over 2%; while coal regains almost 3% of the total market (both on display in red below). Why? Natural gas Henry Hub index pricing began climbing shortly after the commencement of 2021 – especially relative to coal (https://www.eia.gov/todayinenergy/detail.php?id=54459) – due to lower gas inventory counts (i.e. less cushion between supply and demand), and extreme weather events (like Winter Storm Uri) which hinder gas transport and production Coal prices flatlined during this period, which likely encouraged an uptick in coal usage, and a slight decline in lower gird rate pricing correlations. This uptick on index pricing helps explain why the natural gas combustion correlation with relatively higher retail costs for electricity rises. More prolific coal utilization could simply dampen its correlation with lower average rates.

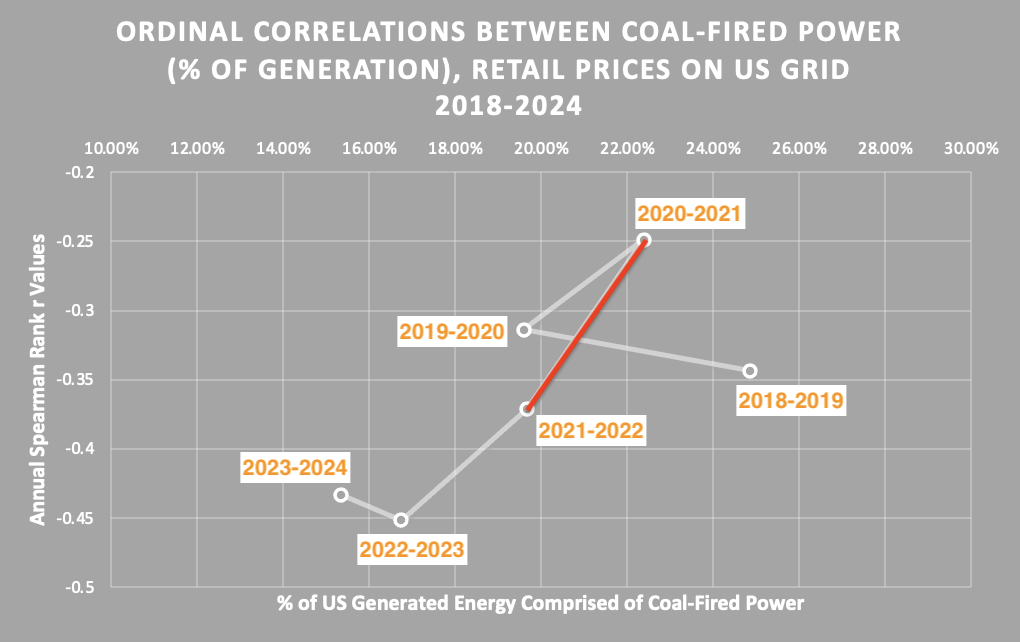
2021-2022: Henry Hub index pricing continued to incrementally climb until August 2022, piercing the $9/MMBtu threshold. The aftershocks of this steady price hike manifested themselves in the red segment of the natural gas correlations line graph on the left. And appear to indirectly contribute to the precipitous improvements in correlations between retail pricing, and both renewable energy and coal-fired combustion penetration rates (also delineated in red in the center and right-side graphs). This time, however, coal continued to lose market share to natural gas; signaling that the thermal generator conversion from the former to the latter could have been fully and irreversibly executed.


This interval between 2020-2021 and 2021-2022 marked the sharpest boost in both coal-fired and VRE’s relationship with lower average grid costs within this six-year analysis.
2022-2023: Natural gas pricing stepped off of a cliff’s edge in September 2022; plummeting all the way down to historic lows (in the $2/MMBtu territory) as 2023 began to unfurl. Substantially improved costs not only spur natural gas power generation to surpass record levels (shown as follows in in the left graph), but even encourage market share-to-lower electricity cost correlations to narrowly meliorate. Interestingly enough – both combined wind/solar and coal-fired power demonstrate strong r values even in the midst of natural gas index pricing declines (also shown in red in the center and right).

While the above, outlined drop in coal-fired generation market shares (in the righ-handed graph) comes as no surprise; the strengthened relationship between coal power and lower grid costs amidst a backdrop of falling natural gas prices certainly raises an eyebrow. Could the diminishing footprint of coal within the US energy matrix allow for more optimized cost structures via:
Lower, necessary coal inventories (and their affiliated costs)?
Limited combustion during summer months and early (yet still warm) fall season (when volatility can been notably higher)?
Reduced instances where coal generators shoulder oscillations in demand from the grid (thereby supporting the aforementioned hypothesis of coal settling into more of a baseload function for the grid)
Could the coupling of BESS with utility-scale wind and solar assemblies help stave off any erosion of the correlation between VRE market share (as a % of energy sales) and average, retail electricity rates when natural gas pricing collapses (and VRE market share grew)?
2023-2024: As gas index prices persisted at or near historic lows (and even squatted beneath the $2/MMBtu barrier for several months in early 2024), natural gas market penetration rates slowly climbed (in red on the left), while its Pearson r value with higher retail rates for the grid somewhat diminished. But in this case – there was a parallel, simultaneous, marginal shrink in the r values of coal combustion (as a % of total generation) and combined wind/solar (as a % of sales); even though market shares further dwindled and swelled (respectively). Could these scant regressions in correlations between lower average power costs and both coal and VRE allude to such ostensibly cheap natural gas?

Some items worth further consideration:
Natural Gas is the most DOMINANT propellant for US grid! If this wasn’t made apparent given its relative composition of our entire, domestic energy matrix; its material costs look to be an influential factor in determining ALL distinct power generation methodology-to-retail costs for electricity correlations…
Pearson r values look to be very much a (unsurprising!) function of pricing (if natural gas in particular) and market share
We are a little befuddled to see that even floor-level natural gas pricing (encapsulated in the 2023-2024 group) still yields a mild correlation with higher electricity costs for the grid! But an interesting result occurs if you adjust for regional outliers:
The NE region, at baseline, endures high costs for utility power; partly a consequence of its comparatively meager domestic pipeline access
The Constitutional pipeline from PA to near Albany, NY was blocked in 2020; which would connect Marcellus shale reserves to existing infrastructure for NH, ME, MA, CN, and RI
The region currently relies on international LNG (which included Russian imports in 2018), Canadian exports, and some transported gas from the Gulf Coast via the Tennessee Gas Pipeline for its natural gas needs. Therefore – natural gas in NE region is inordinately expensive
If you remove the NE region from the 2023-2024 group – subsequent r values:
Plummet all the way to 0.06 as a % of electricity sales (essentially a nonexistent correlation designation!)
Drop to 0.253 as a % of total power generation (a <|0.3| correlation threshold)
A common, pessimistic refrain from natural gas advocates and operators is that increasing volumes of intermittent wind and solar platforms “cannabalize” combustion turbine utilization schedules and capacity factors; relegating them to more chaotic (and less frequent) functional windows. Consequently - natural gas-fired asset costs increase due to do higher, operational volatility and idle times. While this phenomenon sounds reasonable and likely adversely impacts natural gas combustion facility and turbine owners - there’s no discernible evidence in the above correlation data that suggests that higher natural gas power generator costs affect rate payers or average regional utility rates:
The correlations between retail grid cost and natural gas-fired power (as a % of total GWhs supplied to said grid and cumulative sales) remained relatively flat over over this multiyear analysis; even though VRE market penetration (as a % of sales) significantly grew when comparing the bookend data sets from the 2018-2029 and 2023-2024 groups (as explained in the “VRE Correlations: 2018-2024 tab”)
The slight perturbations in the aforementioned, YoY natural gas-related correlations seem linked more to index pricing than any other identified variable…
We currently lack just one consequential power generator on the US grid worth its own separate discussion before we can conclude this multiyear correlation examine: nuclear power.
Stay tuned…