Coal-Fired Power Correlations with Average Retail Electricity Rates: 2018-2024
5/5/2025
In early March, we demonstrated that coal-fired energy on our electrical grid - as a % of total, state-by-state power generation and retail sales - had a mild-to-moderate correlation with (to our surprise!) lower electricity costs by state over a 12-month span from October 2023 to September 2024. This phenomenon somewhat betrayed conventional wisdom; seeing as how coal is almost unilaterally recognized as the more expensive fossil fuel for our domestic power grid when compared to natural gas. Moreover – it begets the following questions:
Did coal-fired power exhibit such correlations during prior years?
How have these correlations between coal-fired power and grid costs changed over time; as the market share for coal combustion across the US electricity matrix has dwindled?
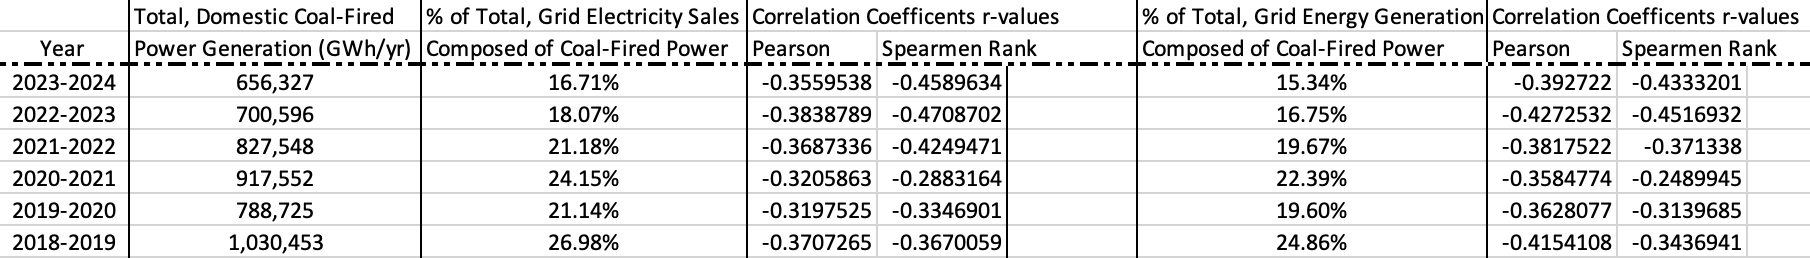
The chart below documents this piecemeal, nationwide decline in cumulative coal-fired combustion – in terms of total GWh/year, and percentages of all generated power and electricity sales - from October 2018 through September 2024 (as stipulated by the EIA). Adjacent to each annual group’s percentage shares are their potential links to electricity prices over their respective time frames; as quantified by the correlation coefficients for parametric and nonparametric data.
(Just as a quick recap: each national group was broken down at the state level. And measured against their respective state’s average, annual price for grid power after HI – an outlier in terms of retail electricity costs – was removed, in order to calculate said group’s Pearson and Spearman Rank r values)
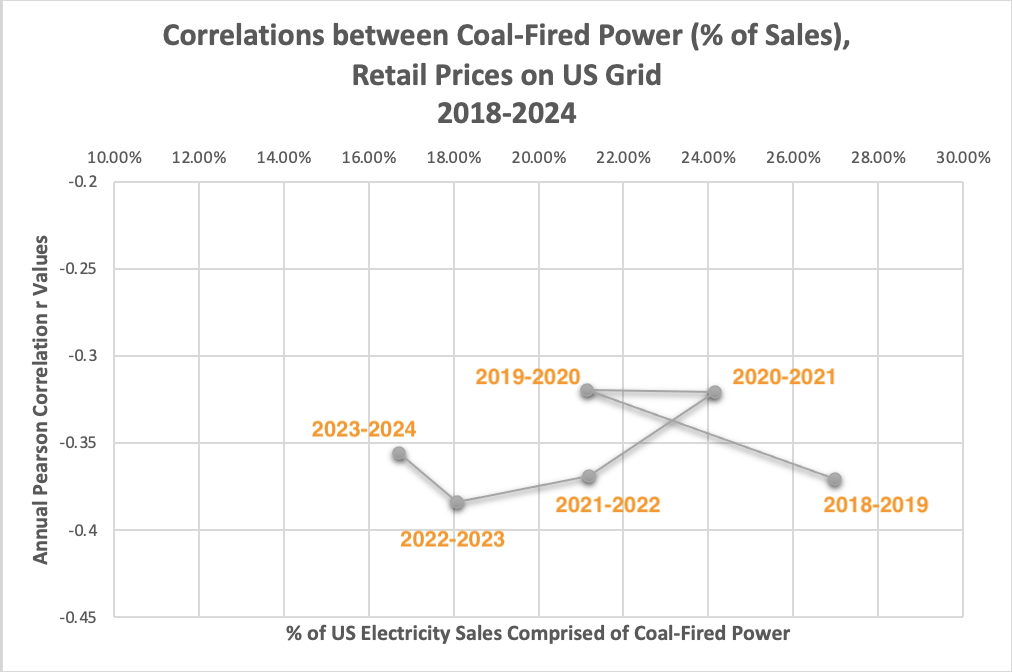
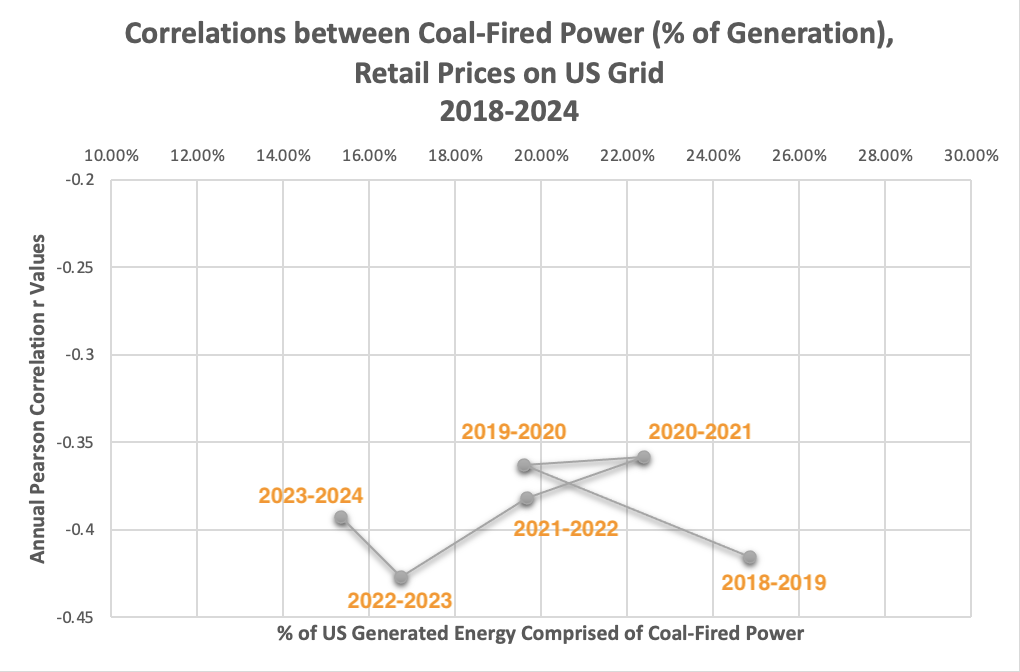
The following line graphs attempt to diagram any trends between changing contributions of coal combustion to the grid (in terms of their shares of total power output and sales) and their strengths of correlation with average pricing over 12-month increments:
It’s difficult to discern any real “trend” in either graph. A few notes here:
Aside from the relative blip associated with the Covid-19 pandemic – Pearson correlation r values appear almost flat; even though US coal-fired combustion – over a six-year period - shrunk by over 35% in total energy output
A 35% reduction certainly appears noteworthy on paper. But are the differences in YoY data populations after being transformed into % of sales and total GWhs generated across each state actually statistically significant?
A single-factor ANOVA analysis was applied to all six data sets under the % of Sales and % of Generation categories (12 sets in total), and quantitatively indicated that – in spite of this aggregated reduction – the between-groups variances across each category were NOT significant:
Both F values fell in between 0.3 and 0.4; F-critical = 2.2487
Both p values hovered near 0.9
Student t-tests were even employed to examine the variances between the groupings that exhibited the widest disparities: those under the 2023-2024 and 2018-2019 listings. And both p values exceeded 0.2; well above the statistically-significant threshold of 0.05
So while cumulative coal-fired power generation across the US dropped appreciably over this six-year period; YoY differences between coal’s contribution to the US grid (in terms of sales and electrical energy) were less profound; and could explain why these YoY r values look nominally equivalent.
But from an ordinal perspective – a trend line starts to materialize:
Recall from the “’23-’24 Statistical Correlations” tab that coal-fired power data as a % of state-by-state grid sales and cumulative power didn’t match a normally-distributed bell curve. Therefore – the non-parametric Spearman Rank Correlation test is prudent for this type of analysis.
These ordinal results point to the prospects that decreasing market shares of coal-fired power on statewide grids have a steadily intensifying congruence with to lower average retail costs for electricity within their respective state.
However – please NOTE that:
Once again - correlations do not equate to causation. So these Spearman Rank results really can’t corroborate the latter above
While the above observation aligns more succinctly with the widely-held assertion that coal-fired electricity is more costly (more so than the Pearson correlation coefficient) - domestic, coal-fired power market penetration rates in the mid-20s still (very) mildly correspond with lower retail electricity costs. So the more costly option – even while controlling about a quarter of the market – is still linked to lower grid rates
The discussion within the “’23-’24 Statistical Correlations” tab made an effort to decipher this finding via:
The age of capital assets associated with coal-fired power generation (older equipment should carry lower amortization burdens)
The relative, steady-state operation of coal-fired assets vs. other fuels (like natural gas)
Could these stronger, ordinal r values over time be a sustained reflection of the unfolding transition from coal to natural gas; as more eligible generators begin combustion of a more dispatchable (and variable) fuel; while older and/or more onerous-to-switch – as well as younger and more efficient – coal-fired generators continue to function on the grid? After all - if the long-term economics favored the switch from coal to natural gas; then odds are these generators would have accomplished it! The expenses associated with this transition would justifiably fall under the natural gas purview. And these mainstay, coal-fired complexes would simply “chug along” at a consistent pace, and proffer energy across select states/regions at a (thus far) preferred rate (which natural gas and even renewable energy cover the overhead of remaining and variable demand).
We find it interesting that this narrative pairs neatly with the nonparametric correlation analysis, while the Pearson tests reveal marginal deviations in correlations between coal-fired power percentages and grid costs. Previously – our examinations have leaned for more heavily into these parametric values since:
The data points appear linear (as delineated in the “’23-’24 Statistical Correlations” tab)
There is a desire to maintain uniformity across each, individual evaluation
Consequently (and due to the fact that the between-group variances across all six data sets used in this analysis were not significantly different) – we do claim that coal-fired power, even at higher grid capacities, exhibit a moderate connection with lower electricity prices across the US! But this could be, in part, a manifestation of fuel transition order: the “higher-cost” coal assemblies started making the switch to gas back in the early 2010s. And as said transition progressed more recently – the generators involved were increasingly similar economically to other forms of power generation. Furthermore – as more and more renewables gained foothold across our energy matrix (along with more dispatchable, natural gas turbines) – these involved generators could function more as baseload power purveyors; not flexible assets whose capacity factors (and associated costs) can swing up and down…
There is some evidence to suggest that dwindling portions of coal-derived energy across the US improved its relationship with lower electricity rates. A few more points to consider here:
Could the nonparametric, coal-fired data and respective retail rates underscore this generator migration from flexible electricity supplier to more of a strict baseload asset?
The repercussion of this migration could be too mild to show up in the YoY Pearson correlations (even though these r values indirectly support this hypothesis)
IF this ordinal data does indeed highlight coal combustion as an increasingly baseload function across the US - then said data reinforces one of the “take-home insights” from the ’23-’24 Statistical Correlation exercise that “dispatchable, baseload generation… curbs utility-scale energy costs more than any other specific resource.”
A common refrain from thermal generation advocates is that VRE + storage platforms cannibalize hydrocarbon combustion assemblies (most notably - those powered by natural gas); thereby lowering their windows of opertion (and capacity factor), and augmenting their opportunities costs. But while domestic VRE penetration has undoubtedly spread across our grid (see the “VRE Correlations: 2018-2024” tab) - and our coal-fired generator footprint has synchronously truncated - these collective correlation coefficients fail to point to any swells in coal-fired power production costs
Could thermal generator cannibalization by VRE systems simply be isolated to just natural gas combustion assets (since they are much dispatchable by nature)?
Could there be some sort of underlining synergy between VRE + storage and coal-fired energy in states/regions where both strategies constitute significant portions of the grid?
For example: wind/solar paired with batteries could minimize the burden of coal-fired assemblies to satisfy daily surges in energy demand (as depicted in the classic, duck-curve diagrams); once again allowing coal-fired units to serve the baseload segment of their grid.
As of the end of Q3 2024 – there appears to be some economical merit from a rate payers’ perspective to further the functionality our domestic, coal combustion asset fleet even without our inevitable, burgeoning demands for grid energy.
As the coal asset fleets age, and require more R&M for reliable operation – how might its correlation with lower grid power costs change?
So US coal-fired power generation could have gradually been molded into a progressively, electricity rate-friendly complex on the grid – presumably as more and more of a baseload component of our energy matrix – as VRE (and storage) began to abut regional networks with supplemental energy, and natural gas continued to become THE dispatchable, thermal generations solution of choice across the US (and absorbing less cost-effective coal-fired assemblies in the process).
So what does this fuel transition look like for the YoY correlations between natural gas-fired power, and average grid costs by state? Recall that gas combustion (as a % of cumulative energy generated) actually produced a mildly positive correlation with higher electricity prices from October 2023 through September 2024 in the “’23-’24 Statistical Correlations” tab. Does this connection preceded earlier years dating back to the end of Q3 2018?
Let’s find out next…